Data Lab
Public numbers first. The subscriber layer is for the working files: source links, assumptions, exportable checklists, and the tactical model behind the chart.
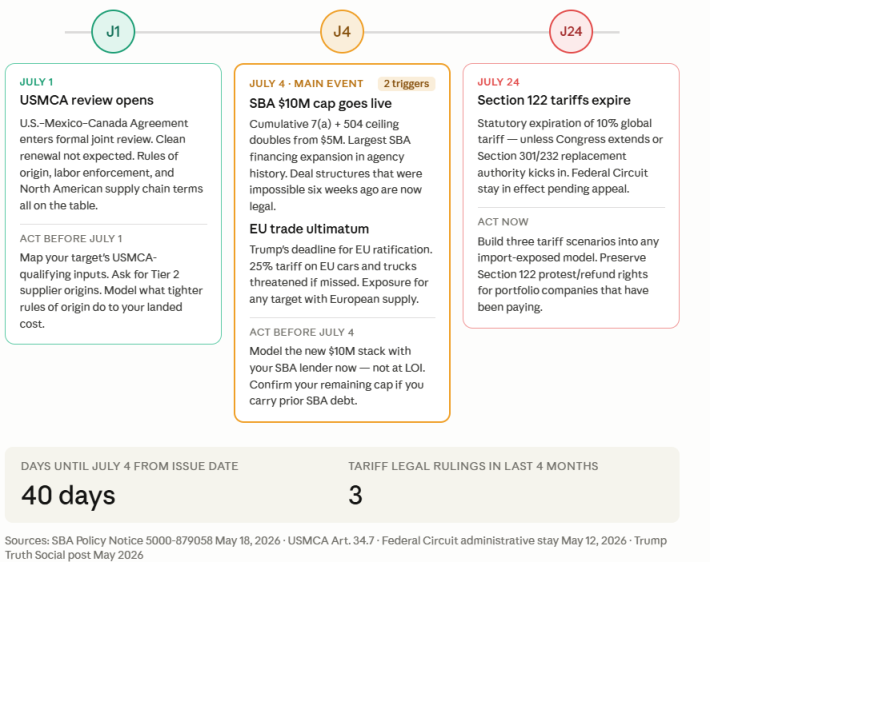
Forty days is not a lot of runway when two of these three deadlines require a lender conversation, a supply chain audit, and a customs attorney — none of which move fast.
The July 4 SBA cap change is the one most buyers will sleep through and regret: the rule is live, the math is better, and the only thing standing between you and a lower cash-to-close on your next deal is a 45-minute call with your SBA lender before you write the LOI.
The USMCA review is the slow-moving train that feels distant until it isn’t. If your target buys Mexican or Canadian inputs under preferential treatment today, that treatment is being renegotiated right now and you should know your exposure before exclusivity.
Section 122 is the wildcard: the tariff may expire July 24, get replaced by something higher under Section 232, or bounce through another appellate stay. Model all three scenarios. Don’t let a seller’s cost deck built on one tariff assumption become your problem at close.
Subscriber Data Pack
Unlock source notes, diligence prompts, and lender-quality questions tied to the weekly Data Lab chart.